Chapter II-Lesson 9 of 10 Transmission Lines - Wave Equations
Instructions
- Read the lecture (displayed below) [30-60 minutes]
- Watch the video (11:47 minutes) [40 minutes]
- Do the exercises [~30 minutes]
Total time = [~1:45 hours]
The Admittance Smith chart:
At high frequencies, it is often preferred to work with admittances instead of impedances. One reason is that most circuit components are mounted in parallel with one terminal grounded. Series components are floating devices and would lead to the circuit suffering from additional undesired parasitic. Working with shunt devices makes admittance expressions more attractive since combining admittances in parallel is achieved through simple addition of their values.
Examining expression (2.101), we can rewrite it in terms of admittance components as follows:
${{Z}_{n}}\left( z~or~d \right)=\frac{Z\left( z~or~d \right)}{{{Z}_{o}}}=\frac{\left[ 1+\Gamma \left( z~or~d \right) \right]}{\left[ 1-\Gamma \left( z~or~d \right) \right]} ~ and ~~ \Gamma \left( z~or~d \right)=\frac{\left[ {{Z}_{n}}\left( z~or~d \right)-1 \right]}{\left[ {{Z}_{n}}\left( z~or~d \right)+1 \right]} \tag {2.101}$
${{Y}_{n}}\left( z~or~d \right)=\frac{Y\left( z~or~d \right)}{{{Y}_{o}}}=\frac{1}{~{{Z}_{n}}\left( z~or~d \right)}=\frac{\left[ 1-\Gamma \left( z~or~d \right) \right]}{\left[ 1+\Gamma \left( z~or~d \right) \right]}~~ and ~~ -\Gamma \left( z~or~d \right)=\frac{\left[ {{Y}_{n}}\left( z~or~d \right)-1 \right]}{\left[ {{Y}_{n}}\left( z~or~d \right)+1 \right]}\tag {2.111}$
Comparing Equations (2.101) and (2.111), we notice the similarity except for replacing the $Z_{n}$ by $Y_{n}$ and at the same time replacing $Γ$ by -$Γ$. Likewise, if we express $Y_{n}$ in terms of its real and imaginary conductance $g_{n}$ and susceptance $b_{n}$, $Y_{n}$= $g_{n}$+$jb_{n}$, we can show that the constant $g$ and $b$ circles are of the form:
${{\left[ -{{\Gamma }_{re}}-\frac{g}{1+g} \right]}^{2}}+{{\left[ -{{\Gamma }_{im}} \right]}^{2}}={{\left[ \frac{1}{1+g} \right]}^{2}} \tag {2.112}$
${{\left[ -{{\Gamma }_{re}}-1 \right]}^{2}}+{{\left[ -{{\Gamma }_{im}}-\frac{1}{b} \right]}^{2}}={{\left[ \frac{1}{b} \right]}^{2}}\tag {2.113}$
which are, again, similar to (2.102) and (2.103) by replacing r and x by g and b and at the same time replacing $Γ_{re}$ and $Γ_{im}$ by –$Γ_{re}$ and –$Γ_{im}$, respectively.
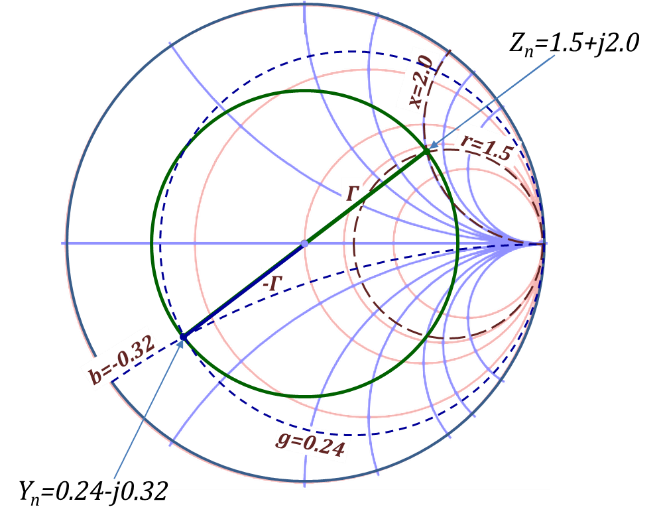
The conclusion is that for a given $Γ$ phasor on the chart (corresponding to a given value of $Z_{n}$=$r$+$jx$), the –$Γ$ phasor on the same chart corresponds to the $Y_{n}$=$g$+$jb$ value at that location on the line.
This concept is demonstrated in the chart of Figure 2.47. The Γ phasor is shown for the normalized impedance $Z_{n}$=01.5+$j$2.0. Thus, the corresponding –$Γ$ phasor reveals to us the corresponding $Y_{n}$ which is $Y_{n}$ = 0.24-$j$0.32. (It is interesting to observe that the chart can be used as a complex number inverter since $Y_{n}$ = 1/$Z_{n}$. Hence, if you place a complex number as the $Z_{n}$, the corresponding $Y_{n}$ point is the inverse of that complex number.)

Figure 2.47
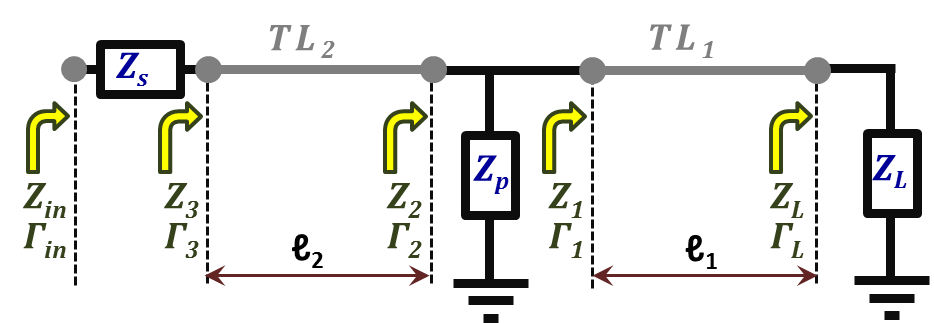
Now that we identified the placement of admittances on the chart, we can actually work out series and parallel combinations in conjunction with segments of transmission lines in a relatively convenient way. To demonstrate, let us consider the example of Figure 2.48.

Figure 2.48
The figure shows a two-transmission line segments $TL_{1}$ and $TL_{2}$, both having the same $Z_{o}$ and $γ$ but different lengths.
The two lines are connected in cascade with a shunt impedance $Z_{p}$ in between. $TL_{1}$ is terminated in $Z_{L}$ while a series impedance $Z_{s}$ is connected at the input side of $TL_{2}$.
It is desired to find the combined circuit input impedance $Z_{in}$ and reflection coefficient phasor $Γ_{ in}$.
To solve this problem analytically, we would start with $TL_{1}$ terminated in $Z_{L}$. Using Equation (2.71), we obtain the input impedance to that segment, $Z_{1}$.
Next, we add $Z_{p}$ in parallel to $Z_{1}$ to get $Z_{2}$. Again, we use Equation (2.71) for $TL_{2}$ terminated in $Z_{2}$ as a load and we get its input impedance $Z_{3}$, and finally, add $Z_{s}$ in series to get $Z_{in}$. To get $Γ_{in}$, we use Equation (2.46).
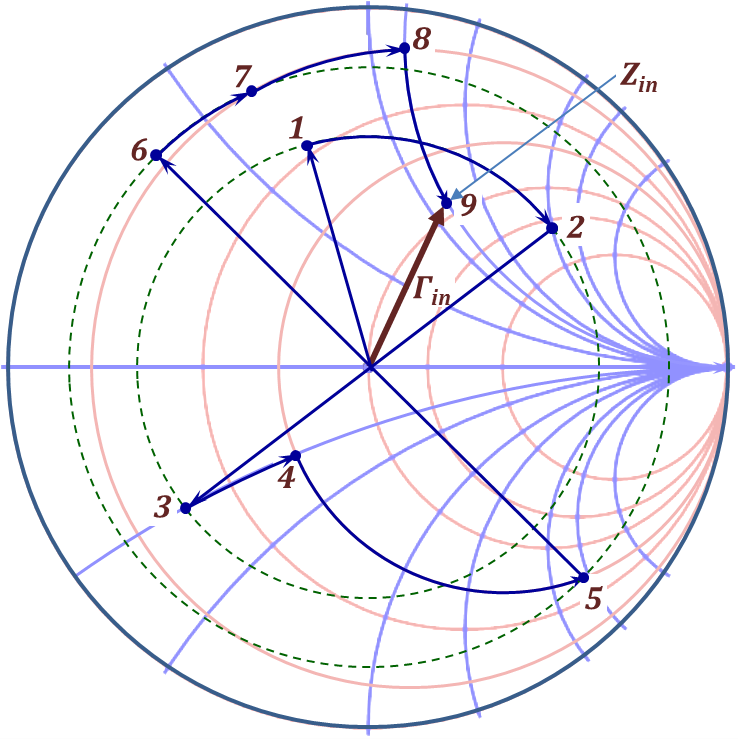
To do this problem using the Smith Chart, we follow the procedure outlined below and demonstrated in Figure 2.49.
1. Choose the normalization impedance to be $Z_{o}$ of the TLs.
2. Compute the normalized $Z_{Ln}$ = $Z_{L}$/$Z_{o}$.
3. Locate $Z_{Ln}$ on the chart and identify the $Γ_{L}$ phasor point [1].
4. Draw a circle centered at the origin passing by $Γ_{L}$.
5. Move on the circle of step 4 above "towards generator" a normalized distance of $ℓ_{1}$/λ. The new point represents $Γ_{1}$ [2]. You may read $Z_{1n}$ and $Γ_{1}$ from this point.
6. Extend the $Γ_{1}$ phasor through the origin to reach the –$Γ_{1}$ point [3]. This is the $Y_{1n}$ point. You may read $Y_{1n}$ off this point.
7. Compute $Y_{pn}$ as 1/$Z_{pn}$ (or $Z_{o}$/$Z_{p}$).
8. Add $Y_{pn}$ to $Y_{1n}$ to obtain $Y_{2n}$. Locate $Y_{2n}$ on the chart [5]. You may read –$Γ_{2}$ off that point.
9. Draw a circle centered at the origin passing by -$Γ_{2}$.
10. Extend the –$Γ_{2}$ phasor through the origin to reach the +$Γ_{2}$ point [6]. This is the $Z_{2n}$ point. You may read $Z_{2n}$ and $Γ_{2}$ off this point.
11. Move on the circle of step 9 above "towards generator" a normalized distance of $ℓ_{2}$/λ. The new point represents $Γ_{3}$ [7]. You may read $Z_{3n}$ and $Γ_{3}$ from this point.
12. Compute $Z_{sn}$ as $Z_{s}$/$Z_{o}$.
13. Add $Z_{sn}$ to $Z_{3n}$ to get $Z_{in}$. Locate $Z_{in}$ on the chart and identify the $Γ_{in}$ phasor point [9]. You may read $Z_{inn}$ and $Γ_{in}$ from this point.
14. De-normalize $Z_{inn}$ to obtain $Z_{in}$ = $Z_{o}$*$Z_{inn}$.

Figure 2.49
It is worth noting that the impedance and admittance additions in steps 8 and 13 above can be performed on the chart. This is simply done by the imaginary part first then the real part (or vice-versa). To add the imaginary part, you move on a constant real part circle the proper amount that corresponds to the added imaginary part. Likewise, to add the real part, you move on a constant imaginary part circle the proper amount that corresponds to the added real part. This is demonstrated in Figure 2.49 in the steps 3-4, 4-5, 7-8, and 8-9.
Smith chart Features and Short Cuts:
1. The commonly known Smith chart prints display circles and portion of circles for the r ≥ 0. Typically, r < 0 (negative resistance) occurs in TL circuits with active devices. For cases requiring r < 0 analysis, a computer produced Smith chart is typically used.
2. A few other scales, Figure 2.50, are typically included in (commercially available) printed Smith charts; among them are:
a. Scale for the standing wave ratio. This scale goes from 1 to ∞ corresponding to the Γ range from 0 to 1, respectively.
b. Scales for normalized voltages and currents. These scales correspond to 1+$Γ$ and 1-$Γ$.
A magnitude scale for both is typically given the name "Transmission Coefficient" which ranges from 0-2.
The corresponding phase angle scale, ranging from -90° to +90° is given on the inner side of the $Γ$ phase angle circle.
3. It is important to notice that a full rotation around the chart (change of /$Γ$ =2π is equivalent to a distance of λ/2. Thus, half rotation of 180° corresponds to λ/4, etc.
- What is the more preferable placement of components in crcuits operating at high frequencies, series or parallel/shunt? Explain why?
- If the normalized impedance of a load connected to a $50~Ohm$TL lies at a point $0.5\ exp\ (j\pi /8)$ on the Smith chart, what is the value of the admittance?
- What is the length of a TL (in wavelengths) required so that the driving point normalized impedance at the source end is equal to the normalized admittance of the load?
Return to Lesson
Return to Video
Examples II.9
- For a ${50~Ohm}$ TL of length ${0.4\lambda }$ and connected to a load ${30+j20~Ohm}$. Using an impedance Smith chart, find the admittance at the load and at the source end locations.
- For the above example, find the length of the transmission line required so that the normalized driving point admittance at the source end of the TL has a real component of unity.
- For the circuit given in the following figure with a $50~Ohm$TL, find the location and value of the shunt admittance that will result in a perfect match to a source having internal resistance of ${50~Ohm}$.

Return to Lesson
Return to Video
Problems II.9
- For the circuit in figure 2.48 with the following given parameters: $Z_s=20~Ohm$, $Z_p=10~Ohm$, ${{Z}_{L}}=30~Ohm$, $Z_o=50~Ohm$, ${{\ell }_{1}}=0.2\lambda $ and ${{\ell }_{2}}=0.3\lambda $. Using the Smith chart, find the following:
- Driving point impedance $Z_2$ (just to the left of$Z_p$).
- Driving point impedance $Z_3$ (just to the right of${{Z}_{s}}$).
- Voltage across the impedance $Z_p$.
- Voltage at the load impedance ${{Z}_{L}}$.